OK, so in my last confession I noted that Excel is my spreadsheet of choice. I should note, however, that there is one thing I absolutely do not use Excel for: graphing. My work is technical enough that I regularly need to make graphs. Frankly, Excel sucks for this. Excel’s defaults are awful. Here’s an exercise for the reader: make a bar graph using Excel’s defaults, and print it on a monochrome printer. You get gray bars on a lined gray background, making it visually impossible to differentiate anything. Nice job, Microsoft! (Now, you might argue that nobody uses monochrome anymore, but that’s not true; most journals in my field still print in monochrome, so they only take monochrome figures.) Furthermore, Excel handles the size of graphs in bizarre ways. If I know I want the x-axis to be 4 inches long, I guess you can get there in Excel, but woe to you if you try to simply resize the window—the graph resizes as well. Bleah.
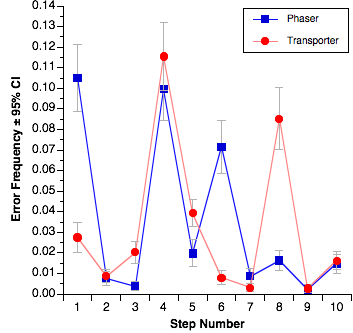
This is another domain in which there used to be a great solution, and now there’s not. The best old-school graphing program for my money was Cricket Graph. Unfortunately, that died a long time ago. The closest thing to that, and what I have used for years now, is DeltaGraph. DeltaGraph is generally pretty good, though there are times when some of the features are better-hidden than they should be. A lot of operations require double-clicking on bits that aren’t immediately obvious, and you have to be pretty precise because double-clicking a few pixels away can give you the wrong dialog box; for example, you can end up with the dialog for grid lines and tick marks when you wanted the dialog for the axis title and units. On the other hand, DeltaGraph does a great job handling fussy bits of the graphs, like error bars. Graphs like this one, where the error bars are different for every graphed point, are actually handled quite well in DeltaGraph:

My only real gripe with DeltaGraph is that it’s getting a bit long in the tooth. It hasn’t been updated in some time and while it runs in OS X, it still feels like an OS 9 application in a lot of ways. Plus it’s gotten buggy and now generates more random crashes than it should. I’m starting to think that it’s been abandoned by its developers and so I’m now keeping an eye open for a new graphing program.
OmniGraphSketcher looks promising, but it doesn’t handle error bars well and so I can’t really go that way yet. Apple’s Numbers and Keynote have the same problem (that is, they also don’t handle error bars well). SPSS is a nightmare when it comes to graphs. Programs like ChartSmith and Aabel look like they might be OK, but they’re bloody expensive.
So, while DeltaGraph is hanging in there so far, I’m “in the market,” as it were. Suggestions welcome…